Bambu Lab Grafana Dashboard for the P1S
Monitor a Bambu Lab P1S - temperatures, print progress, fans, AMS humidity and filament - in Grafana, entirely on your own network. No Bambu Cloud account, no third-party service: a Prometheus exporter talks to the printer's built-in MQTT broker over your LAN and feeds a 22-panel dashboard, with alert rules included.
Watch the setup
The whole build, from unlocking the printer to a live dashboard:
How it works
Bambu printers run an MQTT broker on the printer itself. Once the printer is in
LAN-only mode with developer mode enabled, the exporter subscribes to that broker,
translates the printer's status messages into Prometheus metrics, and serves them on
port 9109. Nothing leaves your network, and the printer never needs to
reach Bambu's cloud.
remote_write.What the dashboard shows
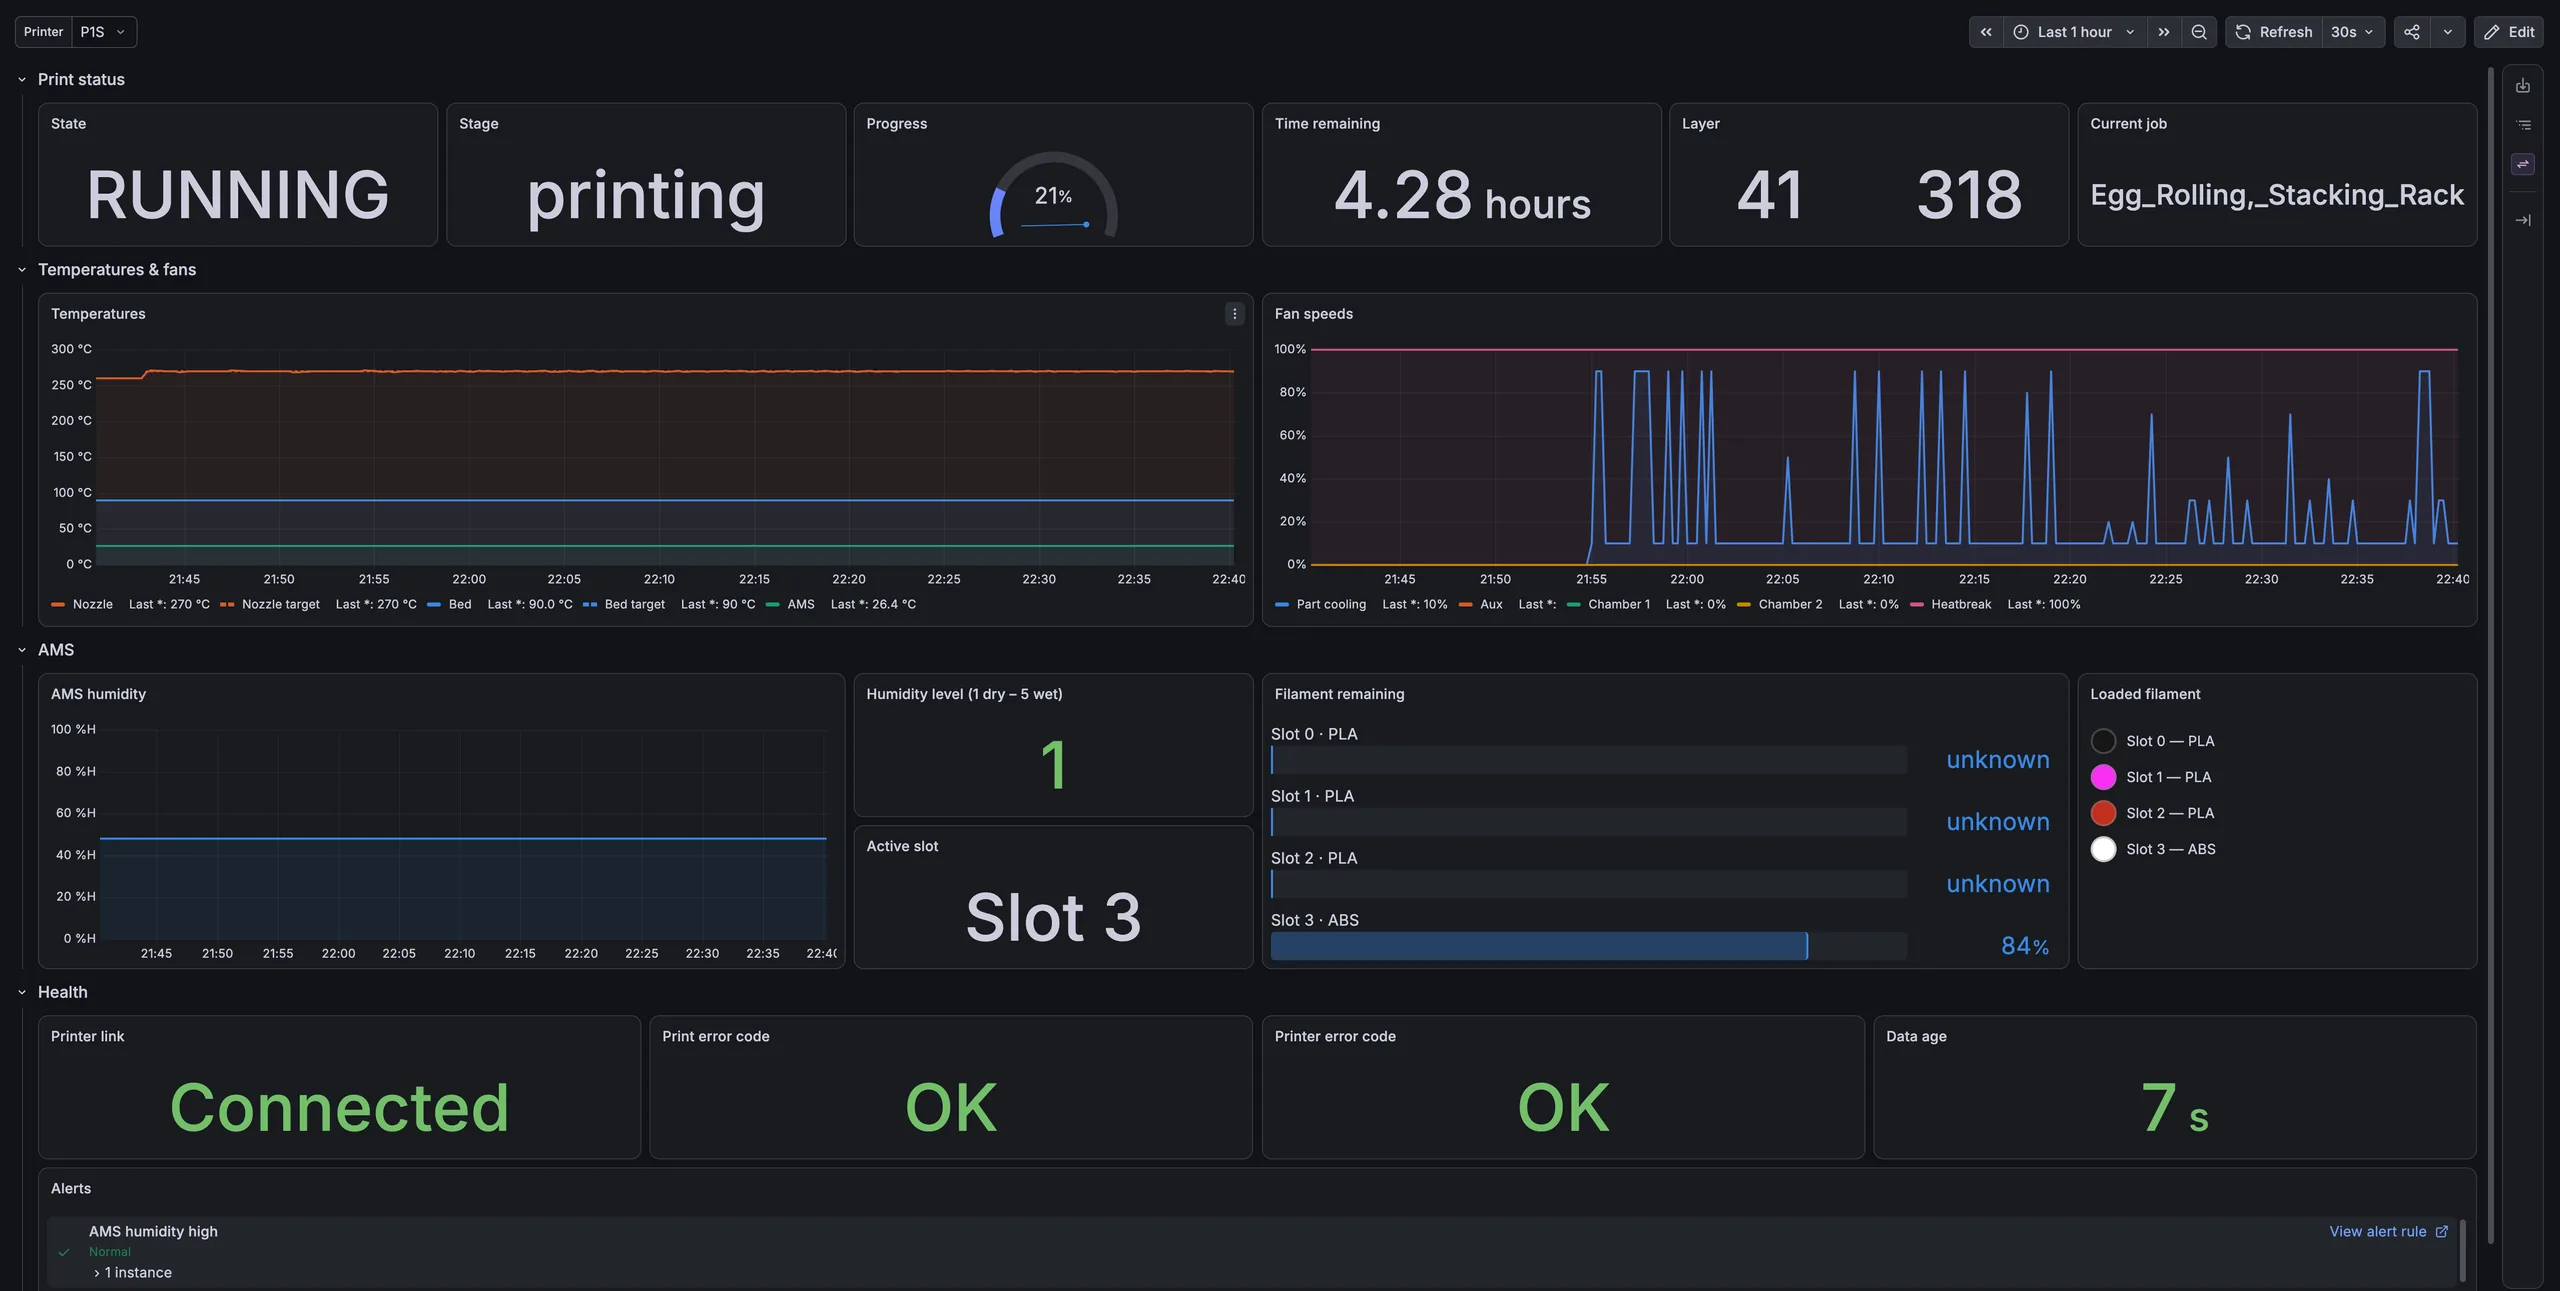
Print status
State, stage, progress, time remaining, layer and job name.
Temperatures & fans
Nozzle and bed against target, AMS temperature, all five fans.
AMS
Humidity and level, filament per slot, spools in their real colours.
Health
Printer link, error codes, data freshness, alert states.
Before you start: unlock the printer
This is the part that trips most people up. Current Bambu firmware locks down local MQTT, so the printer will refuse the exporter until you change two settings on its touchscreen.
- Enable LAN-only Mode (Settings → Network). This disconnects the printer from Bambu Cloud and the Handy app; Bambu Studio on the same network keeps working.
- Enable Developer Mode. This is what actually re-opens the local MQTT channel.
- Note the IP address and access code (Settings → WLAN), and give the printer a static DHCP lease in your router so the address does not move.
- Find the serial number - it is on the printer screen, or you can read it out of the printer's TLS certificate:
echo | openssl s_client -connect <printer-ip>:8883 2>/dev/null | grep subject
# subject=/CN=01P00A...   <- that's the serial
Trade-off worth knowing: LAN-only mode means no remote monitoring through the Bambu app while you are away. You are swapping cloud convenience for local control and real metrics.
Quick start
git clone https://github.com/dmitrylambert/bambulab-grafana-monitoring.git
cd bambulab-grafana-monitoring
cp .env.example .env    # fill in IP, access code, serial
docker compose up -d
curl http://localhost:9109/metrics | grep bambulab_printer_connected
Then point your Prometheus at the exporter:
scrape_configs:
  - job_name: bambulab
    scrape_interval: 15s
    static_configs:
      - targets: ["<exporter-host>:9109"]
<exporter-host> is wherever the exporter container runs - not the
printer. Use the service name bambulab-exporter if Prometheus sits in the
same compose stack, localhost if Prometheus runs on the same machine, or
that machine's LAN IP from anywhere else.
Which dashboard file to import
There are two copies of the same dashboard. Picking the wrong one is the most common installation problem, so choose by how you install it:
| How you install | Use this file |
|---|---|
| Import Grafana → Dashboards → Import, pasting the JSON |
dashboards/p1s-grafana-com.jsonGrafana asks which Prometheus datasource to use. |
| Provision a file in provisioning/dashboards/ |
dashboards/p1s.jsonExpects your Prometheus datasource to have UID prometheus. |
Do not swap them. The import variant provisions with unresolved datasource references, and the provisioning variant fails the schema check that grafana.com applies to uploads - which is where its filename comes from.
One optional plugin
The Loaded filament panel uses the Business Text plugin
(marcusolsson-dynamictext-panel) and needs
GF_PANELS_DISABLE_SANITIZE_HTML=true. Every other panel is vanilla
Grafana - skip both and you lose only that one panel.
Alerts
alerting/bambulab-rules.yaml is a Grafana alerting provisioning file. Drop
it into /etc/grafana/provisioning/alerting/ and attach your own contact
points.
| Rule | Fires when |
|---|---|
| Print error | The printer reports a non-zero print error code. |
| Printer offline | No healthy printer connection for 5 minutes, including the exporter being down. |
| AMS humidity high | AMS humidity level reaches 4 or above for 30 minutes - time to swap the desiccant. |
Troubleshooting
Filament remaining shows "unknown"
Enable Update remaining capacity in Bambu Studio: Device tab → the gear icon beside the AMS graphic. The estimate fills in as each spool is next loaded.
Metrics are labelled bambulab instead of the printer name
LAN mode cannot discover the printer's name, so set BAMBULAB_PRINTER_NAME
yourself - it becomes the printer_name label on every metric.
Where is chamber temperature?
The P1S has no chamber temperature sensor. The value it reports is meaningless, so it is deliberately left off the dashboard.
Credits and licence
The exporter is built from dmitrylambert/bambulab_metrics_exporter, a fork of TheBlackBush/bambulab_metrics_exporter (GPL-3.0) carrying a fix for a startup deadlock in local MQTT mode. The dashboard and alert rules are Apache-2.0.
Monitoring something that actually matters?
A 3D printer is a friendly place to learn this stack. If you need the same visibility across servers, networks or production systems, tell me what you are trying to see and I will reply with how I would approach it.