Grafana Tools
Complete monitoring stacks, not just dashboard JSON - plus the integrations that fill
the gaps Grafana leaves. Each one ships as a docker compose you can run
today: the exporter that produces the metrics, the dashboard that displays them, and
the alerting that gets you out of bed.
SMS & Voice Call Alerts
Grafana cannot text or phone you. This webhook adapter can - one contact point, and each rule picks SMS or a text-to-speech call.
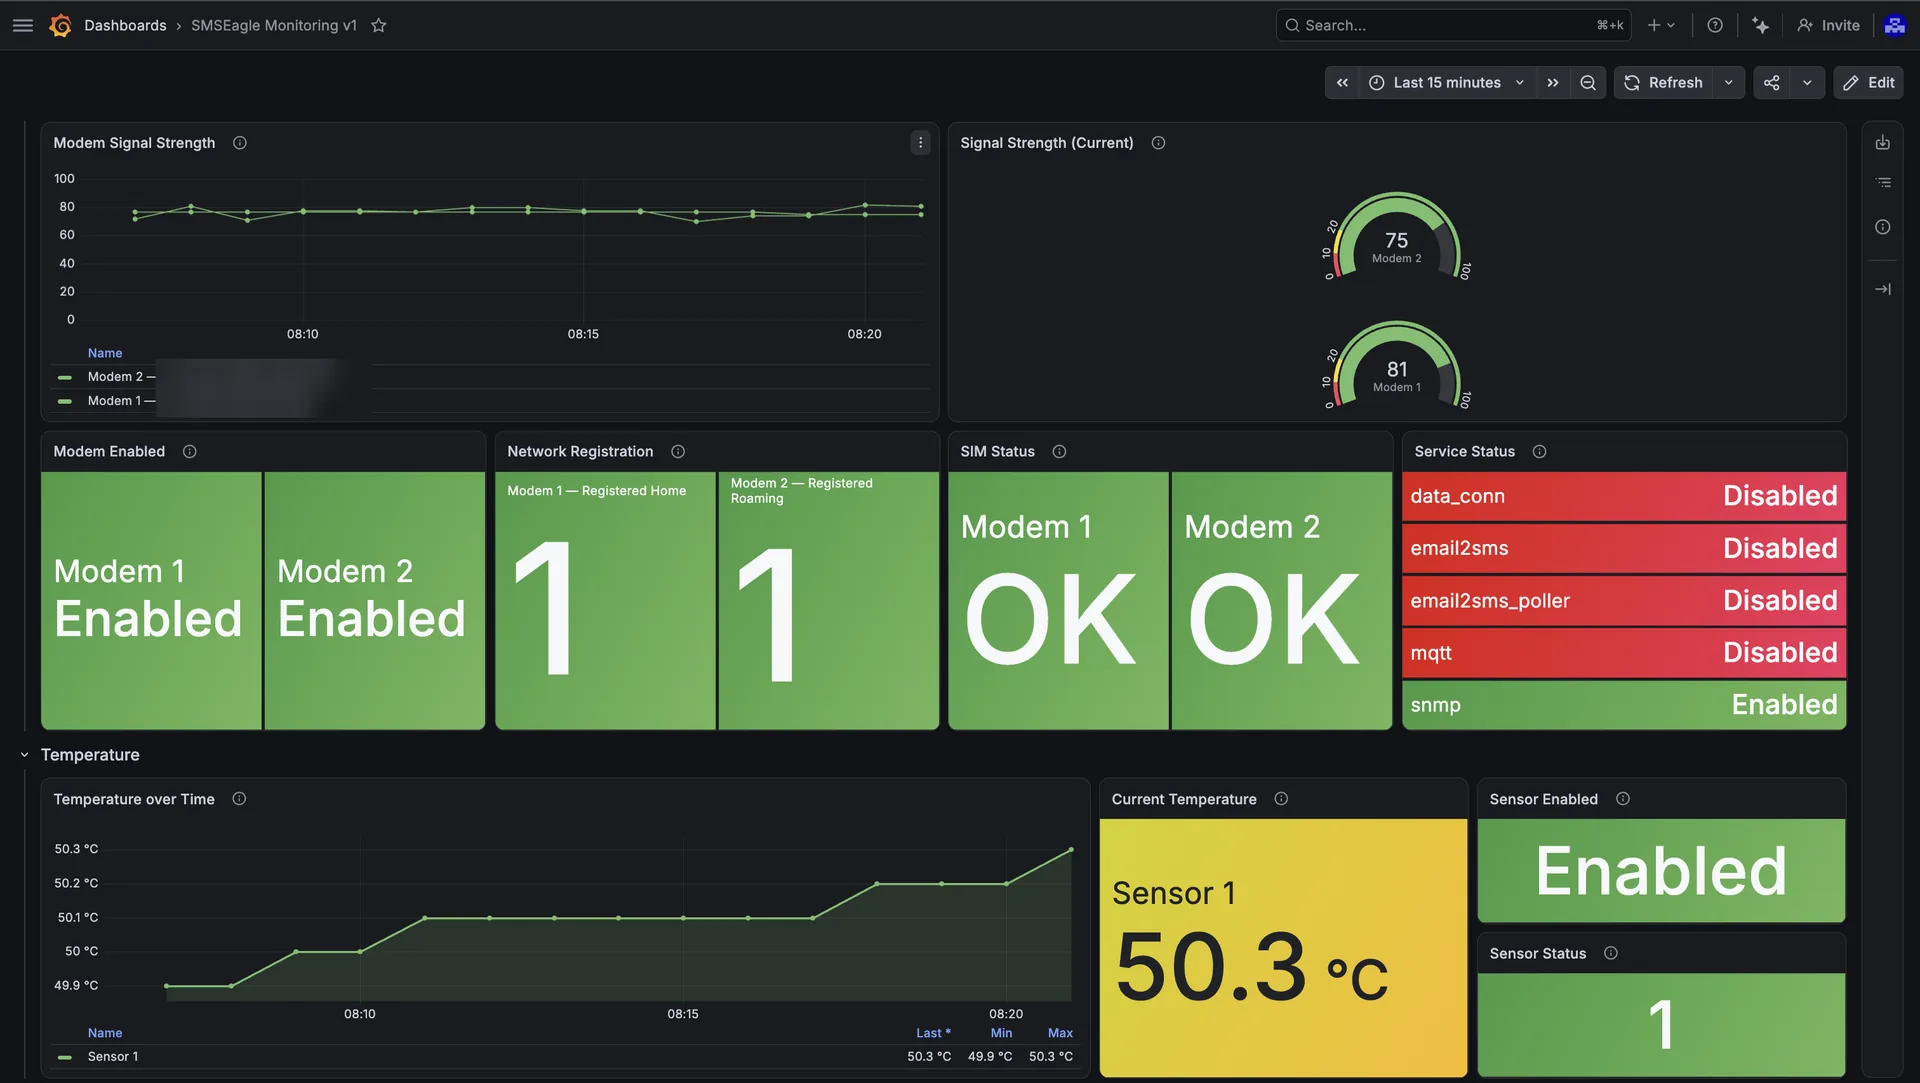
SMSEagle SMS Gateway
Modem signal, SIM and network registration, message queues per channel, SMPP and temperature - pulled from the APIv2, no SNMP. Ships with an offline mock.
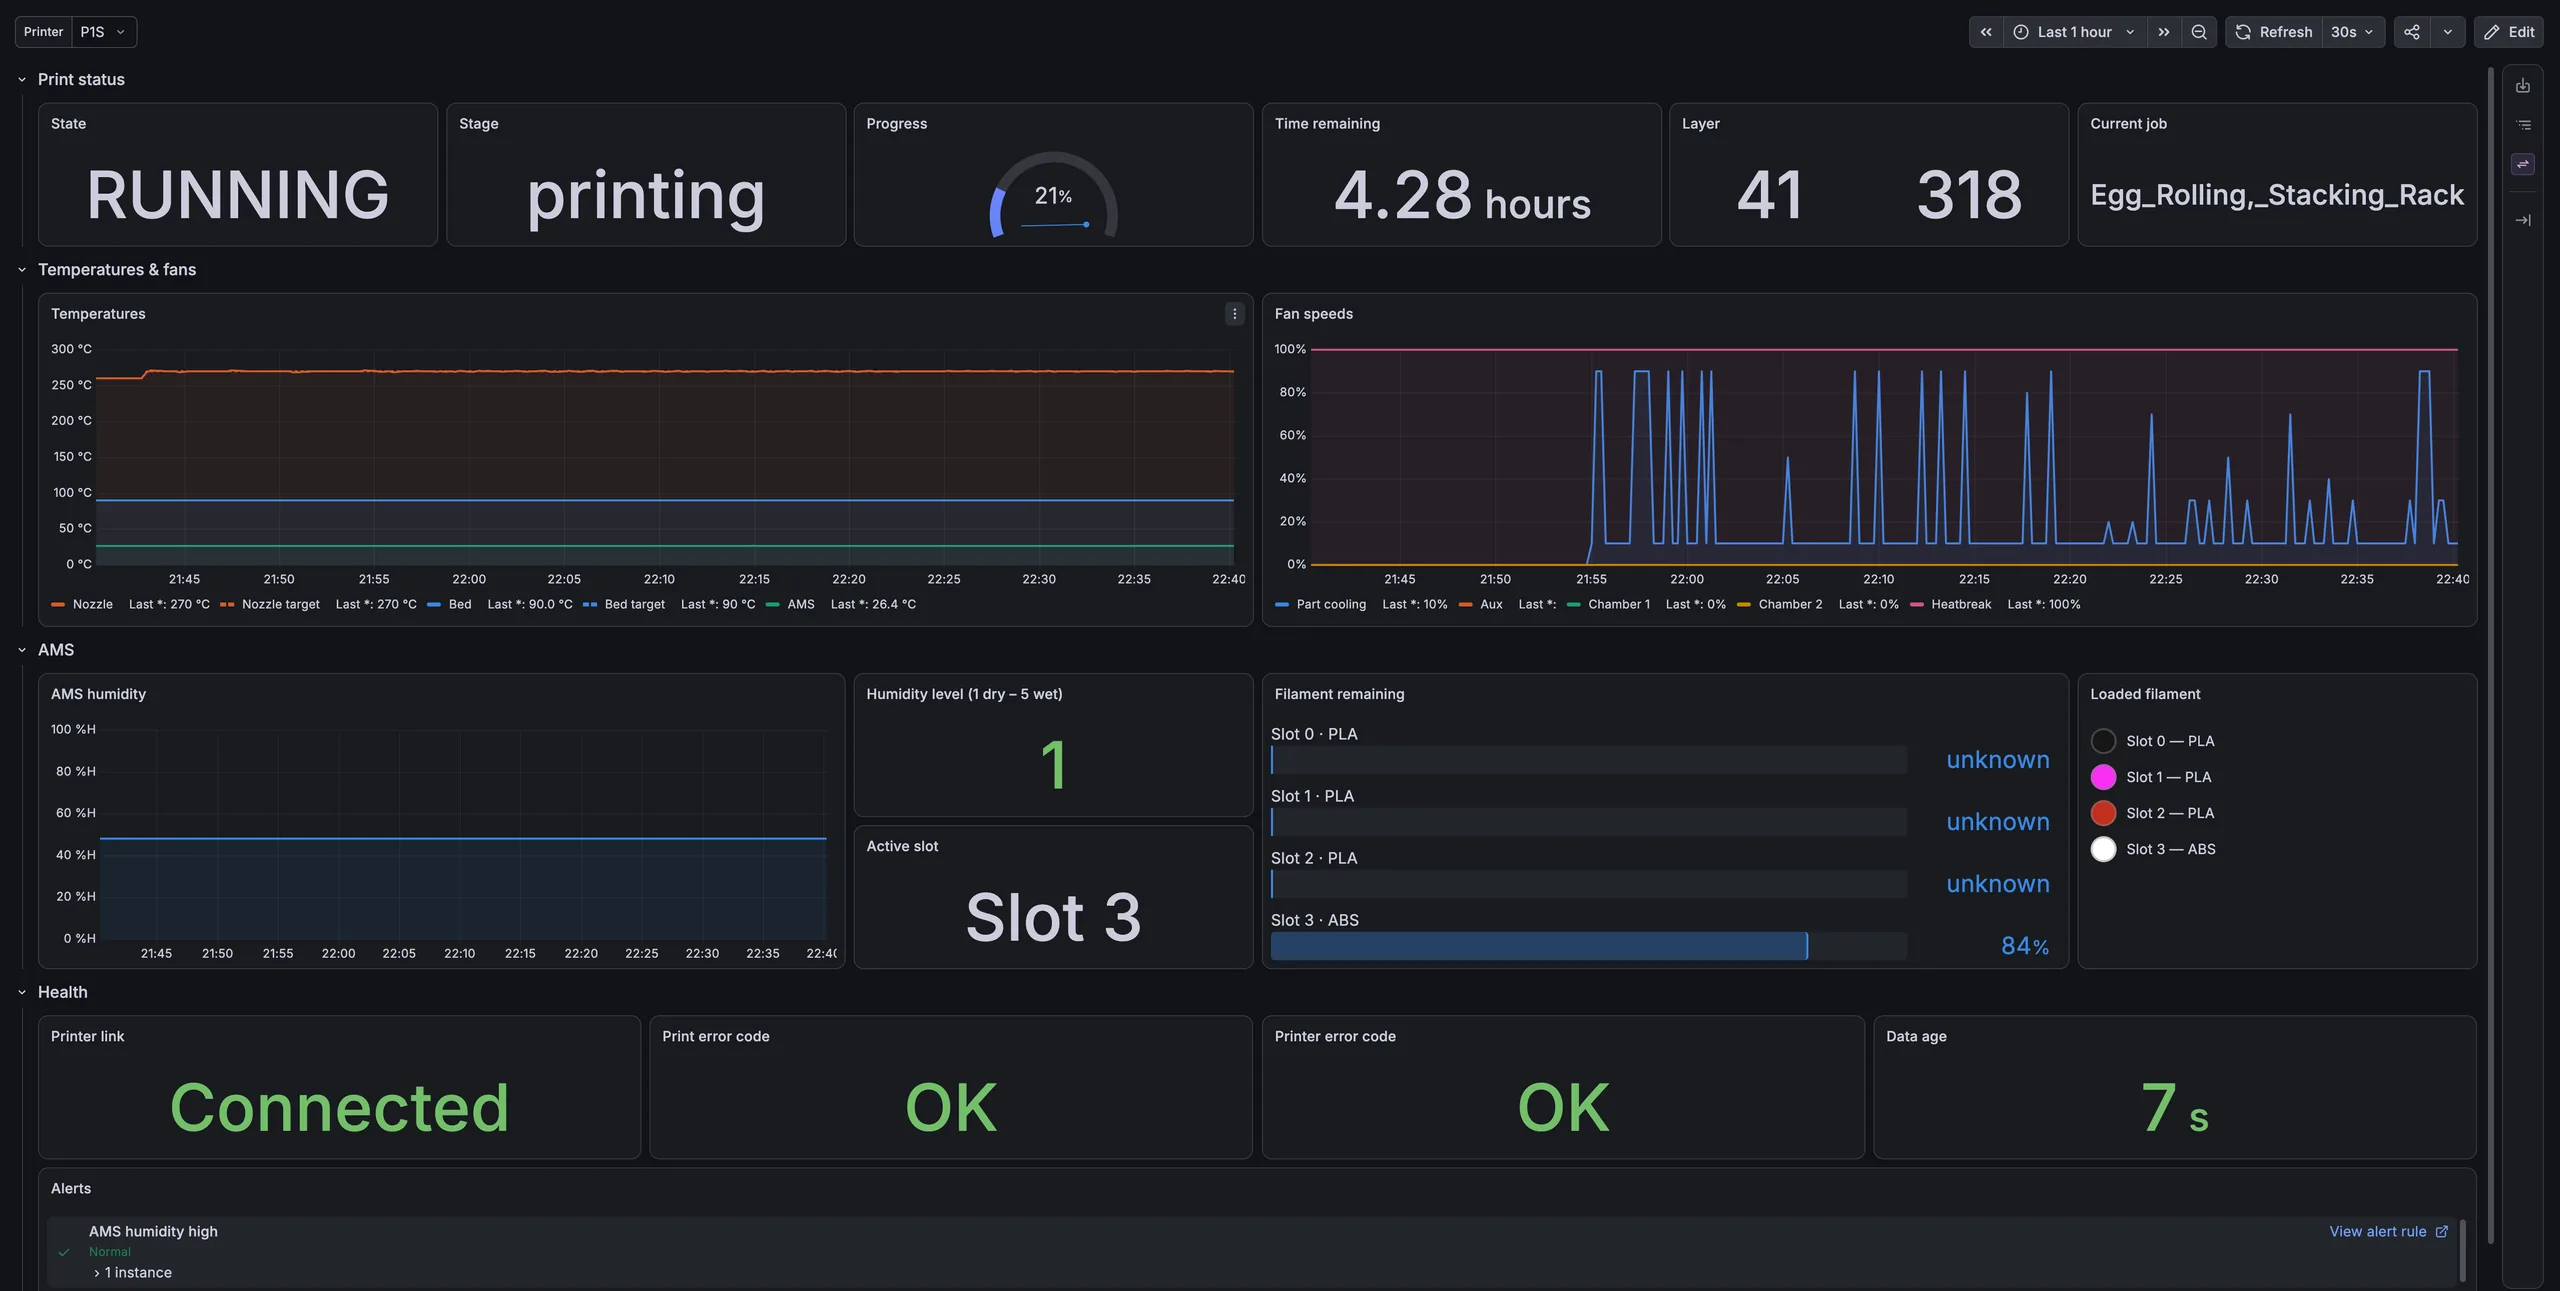
Bambu Lab P1S 3D Printer
Temperatures, print progress, fans, AMS humidity and filament - read from the printer's local MQTT broker. No Bambu Cloud account required.