SMSEagle Grafana Dashboard
Your SMS gateway is the thing that tells you everything else is broken - so it is worth watching too. This stack pulls an SMSEagle device's APIv2 into Prometheus metrics and ships them to Grafana Cloud: modem signal, SIM and network registration, message queues per channel, SMPP, temperature and firmware status. No SNMP, and an offline mock so you can build the whole thing before you touch the device.
Watch the setup
The full walkthrough, from empty folder to live dashboard:
What the dashboard shows
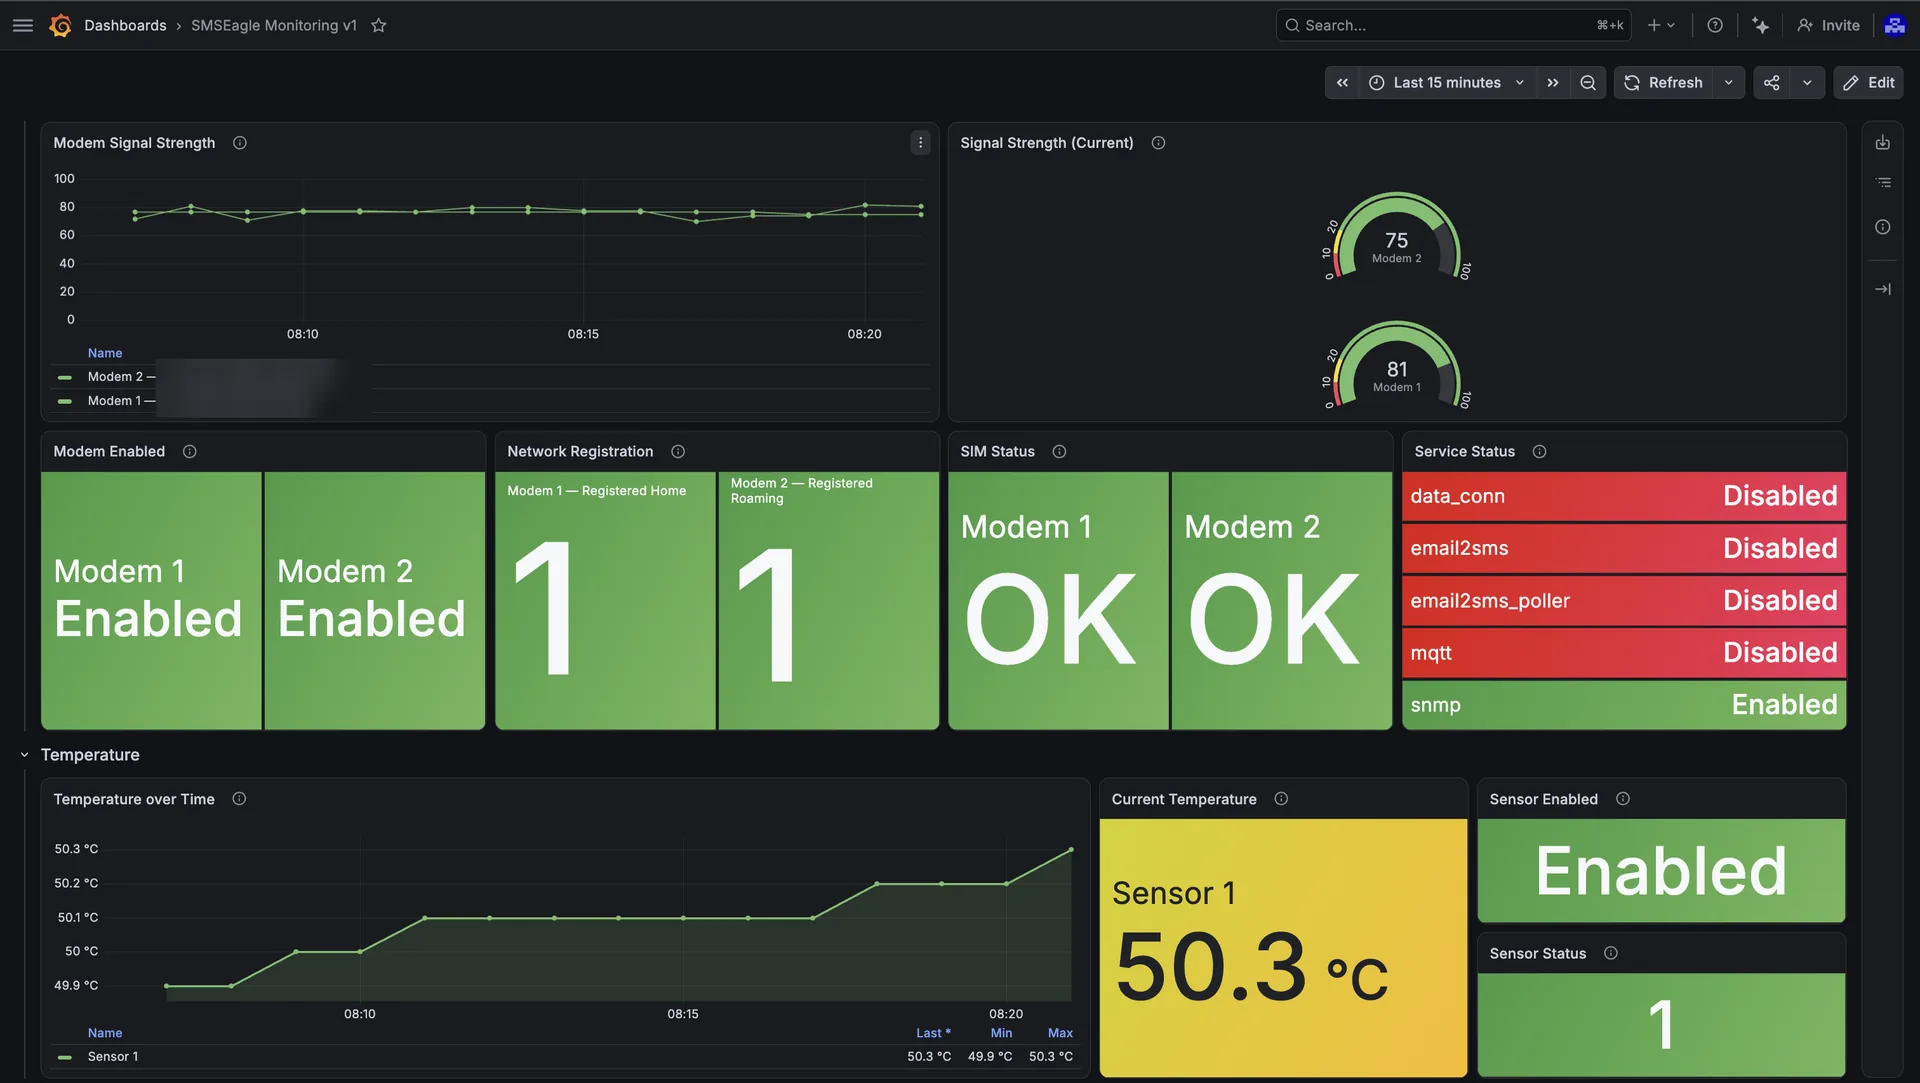
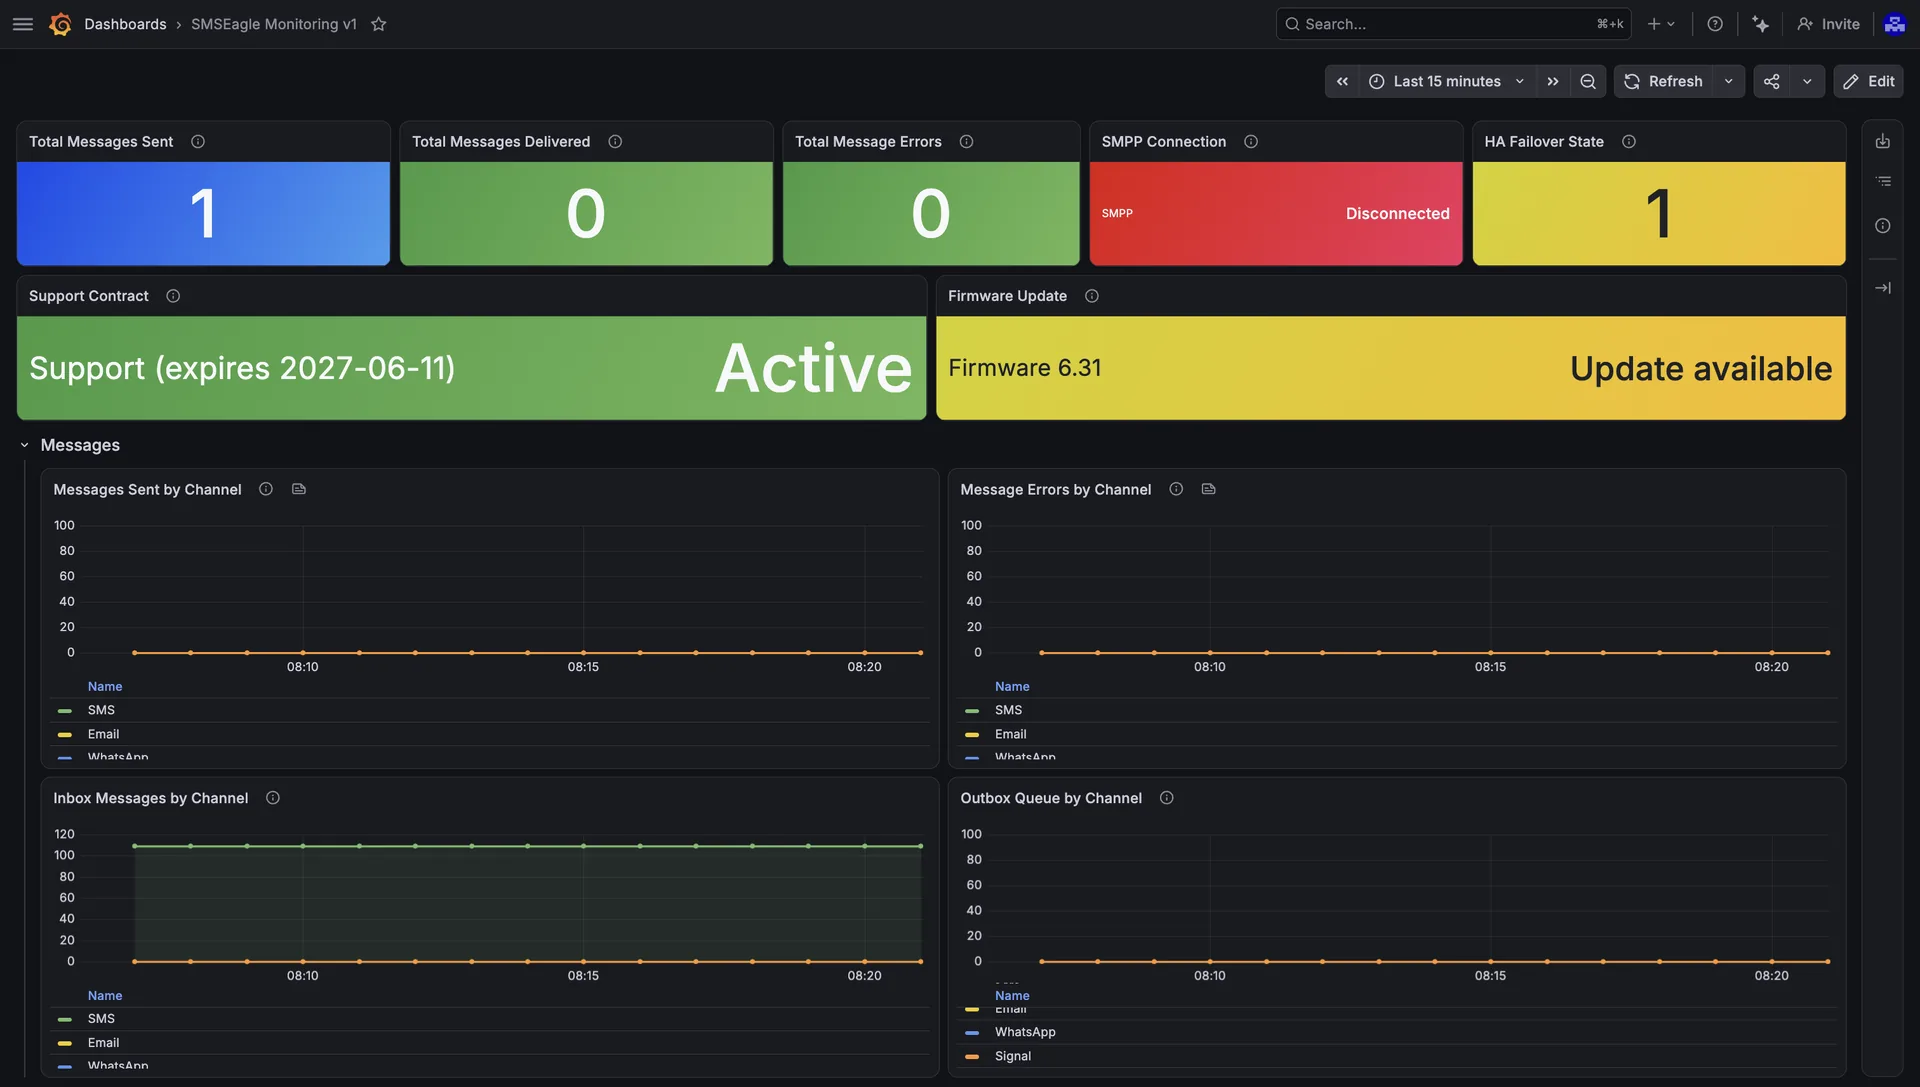
How it works
Everything comes from the SMSEagle APIv2 - no SNMP to configure. A json-exporter sidecar maps the JSON responses onto Prometheus metrics, and Grafana Alloy scrapes those and remote-writes them to Grafana Cloud.
.env.| Service | Image | Purpose |
|---|---|---|
alloy | grafana/alloy |
Scrapes metrics and remote-writes to Grafana Cloud. UI on :12345. |
json-exporter | prometheuscommunity/json-exporter |
Maps SMSEagle JSON onto Prometheus metrics. :7979. |
mock-smseagle | nginx:alpine |
Serves captured API responses for offline development. :8088. |
Quick start
git clone https://github.com/dmitrylambert/grafana-monitoring.git
cd grafana-monitoring/smseagle-monitoring
cp .env.example .env    # APIv2 token + Grafana Cloud Prometheus credentials
docker compose up -d
Then check it locally - the Alloy UI on
http://localhost:12345, and the mock API on
http://localhost:8088/api/v2/modem/full_info.
Build it without the device
The repo ships captured API responses, so you can develop offline. Toggle the source
with one line, then restart - config and environment changes need a restart, not
up -d:
# MOCK (offline, no device needed):
SMSEAGLE_API_URL=http://mock-smseagle/api/v2
# LIVE (requires LAN access to the device):
# SMSEAGLE_API_URL=https://<device-ip>/api/v2

docker compose restart alloy
The APIv2 token travels as the access_token query parameter, so the mock
simply ignores it - any dummy value works offline. While you are on the mock, values
are static: status panels read green and graphs stay flat.
Metrics it collects
| Metric | Labels | API source |
|---|---|---|
smseagle_modem_signal_strength | modem_no, net_name, sim_status, registration_status, imei | /modem/full_info |
smseagle_modem_enabled | modem_no | /modem/full_info |
smseagle_modem_sim_status | modem_no, sim_status | /modem/full_info |
smseagle_modem_network_registration | modem_no, registration_status | /modem/full_info |
smseagle_messages_{inbox,outbox,sent,error,delivered} | channel - sms, whatsapp, signal, email | /messages/count |
smseagle_update_available | version | /device/version |
smseagle_support_active | expiry_date | /device/support |
smseagle_service_enabled | service - snmp, mqtt, email2sms, data_conn | /device/<svc>/status |
smseagle_smpp_{enabled,connection,core,sms,sql} | — | /device/smpp/status |
smseagle_ha_failover_state | status | /device/ha_failover/status |
smseagle_temperature_celsius | sensor_id | /device/temperature_sensor/<id>/read |
smseagle_humidity_percent | sensor_id | /device/temperature_sensor/<id>/read |
Alerts worth setting
Four queries that catch the failures that actually matter on a gateway:
smseagle_messages_outbox{channel="sms"} > 20               # outbox backing up
increase(smseagle_messages_error{channel="sms"}[15m]) > 0  # new send failures
smseagle_modem_sim_status{sim_status!="Operational"}       # SIM problem
smseagle_modem_signal_strength < 30                        # weak signal
Importing the dashboard
Two ways in, and both start at Dashboards → New → Import in Grafana.
From the Grafana library - dashboard ID 25521
Type 25521 into the import box and press Load. Grafana
pulls
SMSEagle Gateway Monitoring
from grafana.com - nothing to clone or download first.
From the repo
Upload dashboards/smseagle.json or paste its JSON. Use this copy when you
want the exact version that ships alongside the collector config, or when you are
provisioning the dashboard from a file rather than importing it by hand.
Either way, pick the Prometheus data source that receives your SMSEagle metrics - the dashboard ships parameterised, so it will prompt you.
Panels reading "No data"? Confirm the metrics are actually arriving
by querying {__name__=~"smseagle_.+"} in Explore, and check you picked
the right data source. The dashboard opens on the last 6 hours.
Re-importing the same JSON with the same UID overwrites your copy - Grafana warns first. To keep local edits, import under a new name or change the UID beforehand.
Adding more endpoints
The SMSEagle API exposes more than this dashboard uses. To pull in another endpoint:
- Add a module mapping in
json-exporter/config.yml- paths use Kubernetes JSONPath, so{.field}selects a field,{[*]}iterates an array and{$}takes a single object. - Add a scrape target in
alloy/config.alloy. docker compose restart json-exporter alloy.
Need this watching something bigger?
The same pattern - API to Prometheus to Grafana - works for almost any device or service that exposes JSON. Tell me what you need visibility into and I will reply with how I would approach it.