An AI coach for your Garmin data, running on your own computer
A Garmin watch knows your resting heart rate, your HRV, how well you slept for the last three years and every activity you have ever recorded. What it will not do is let anything else read that. Garmin Connect shows you the numbers and stops there - no public API, no clean export, nothing an AI tool can reach.
So I built the missing half. It pulls everything down onto my own machine, stores it in a local database, layers proper sports-science analytics over the top, and puts a Claude coach in front of it that can actually see all of it. Three videos, three evenings, and it went from a prototype to something I use every morning.
This is the write-up of how it works, what the interesting parts were, and - since a lot of people asked - how to run the whole thing yourself without writing any code.
The problem: your data is yours, but it is stuck
Garmin does not really want you pulling data out of Garmin Connect and feeding it somewhere else. There are no clean, publicly open API endpoints for it. You can log into the web interface and export to CSV, but that is manual work: finish a session, open Connect, wait for the export, drop it into a spreadsheet or some other tool, then do the analysis by hand. Every single time.
That is too much friction for something you would want to look at daily, so the app uses the well-known Garmin Connect library instead. It is reverse-engineered rather than official: it authenticates and calls the internal endpoints while presenting itself as ordinary Garmin usage, so nothing looks suspicious enough to get an account flagged. It returns essentially everything the watch collects.
Worth being clear about: this is not sanctioned by Garmin. That is exactly why this will never exist as a public garmin-ai-coach.com service, and why it is built as something you run locally against your own account. Garmin changing an internal endpoint can break a sync, so each metric is fetched independently - one broken endpoint degrades a single widget instead of failing the whole run.
The MFA problem
One thing the library does not handle: multi-factor authentication. If your device supports ECG readings - a Fenix 8, for instance - Garmin treats that as a trigger and emails you a code at login. The upstream library has no path for that, so the app replicates the SSO ticket exchange itself and adds a second prompt for the emailed code. Once the ticket is obtained, the library's own helpers turn it into OAuth tokens, which are cached locally for about a year. You log in once.
What it actually looks like
Four surfaces, all local, all reading from the same synced database. The today view is the plain one - training readiness, HRV, body battery and sleep score, a recovery snapshot, HRV over the last fortnight, a 30-day activity calendar and your recent sessions. Useful, but on its own it is the data the phone app already shows, just gathered onto one page. The interesting parts sit behind it.
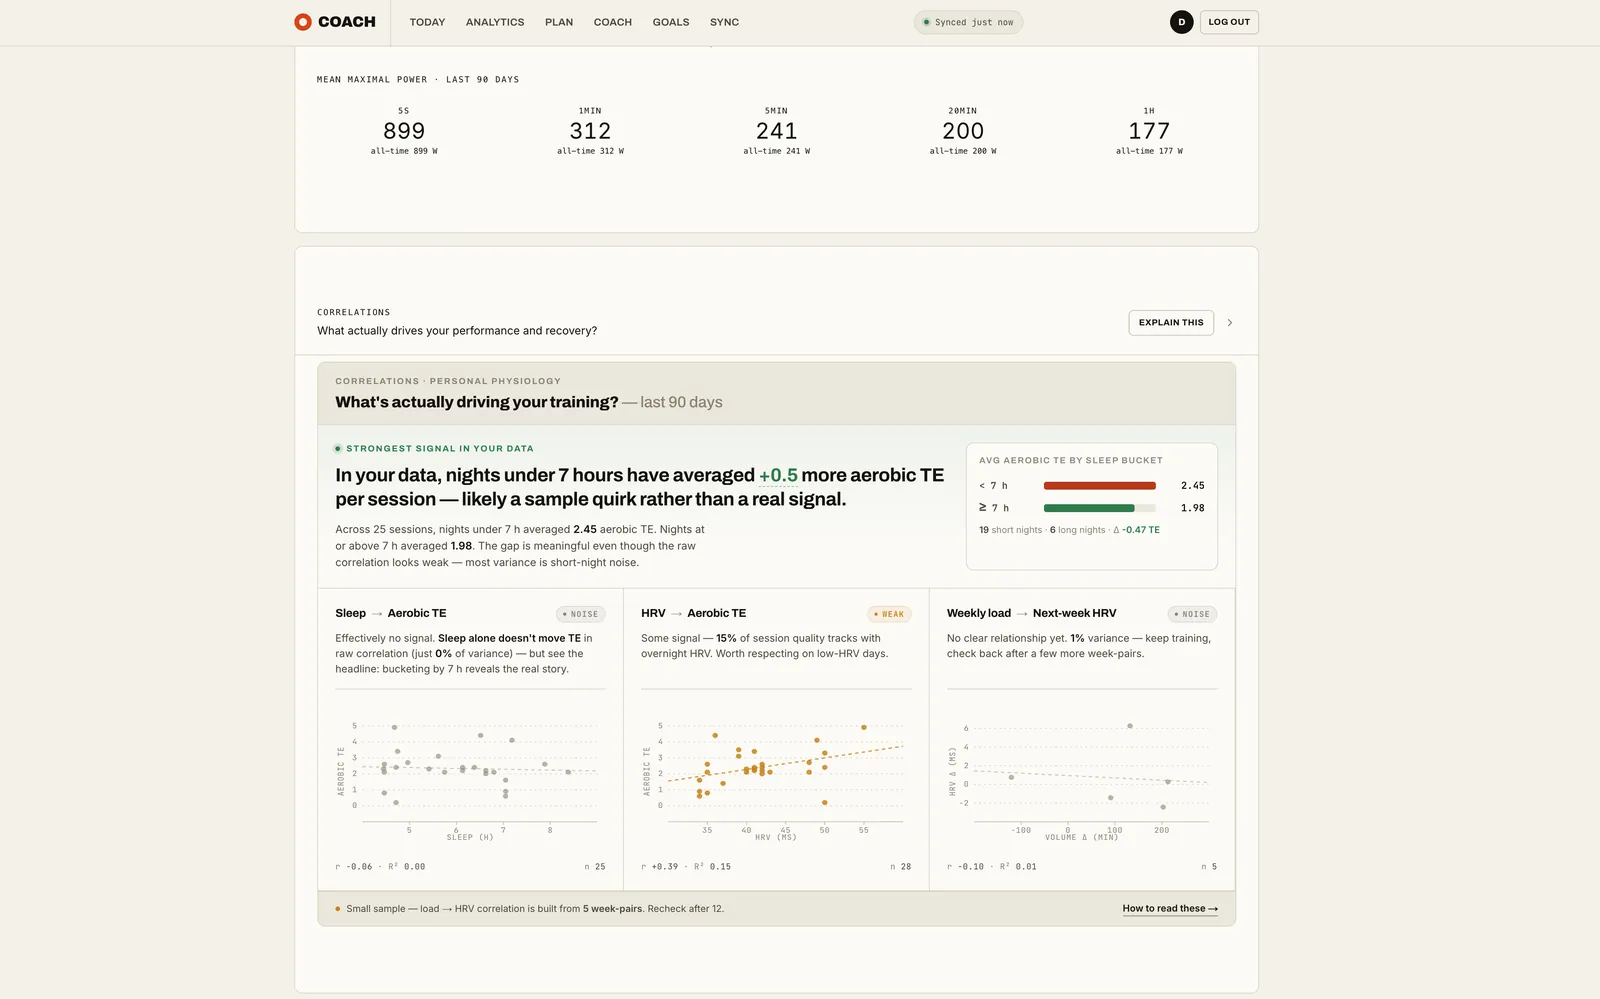
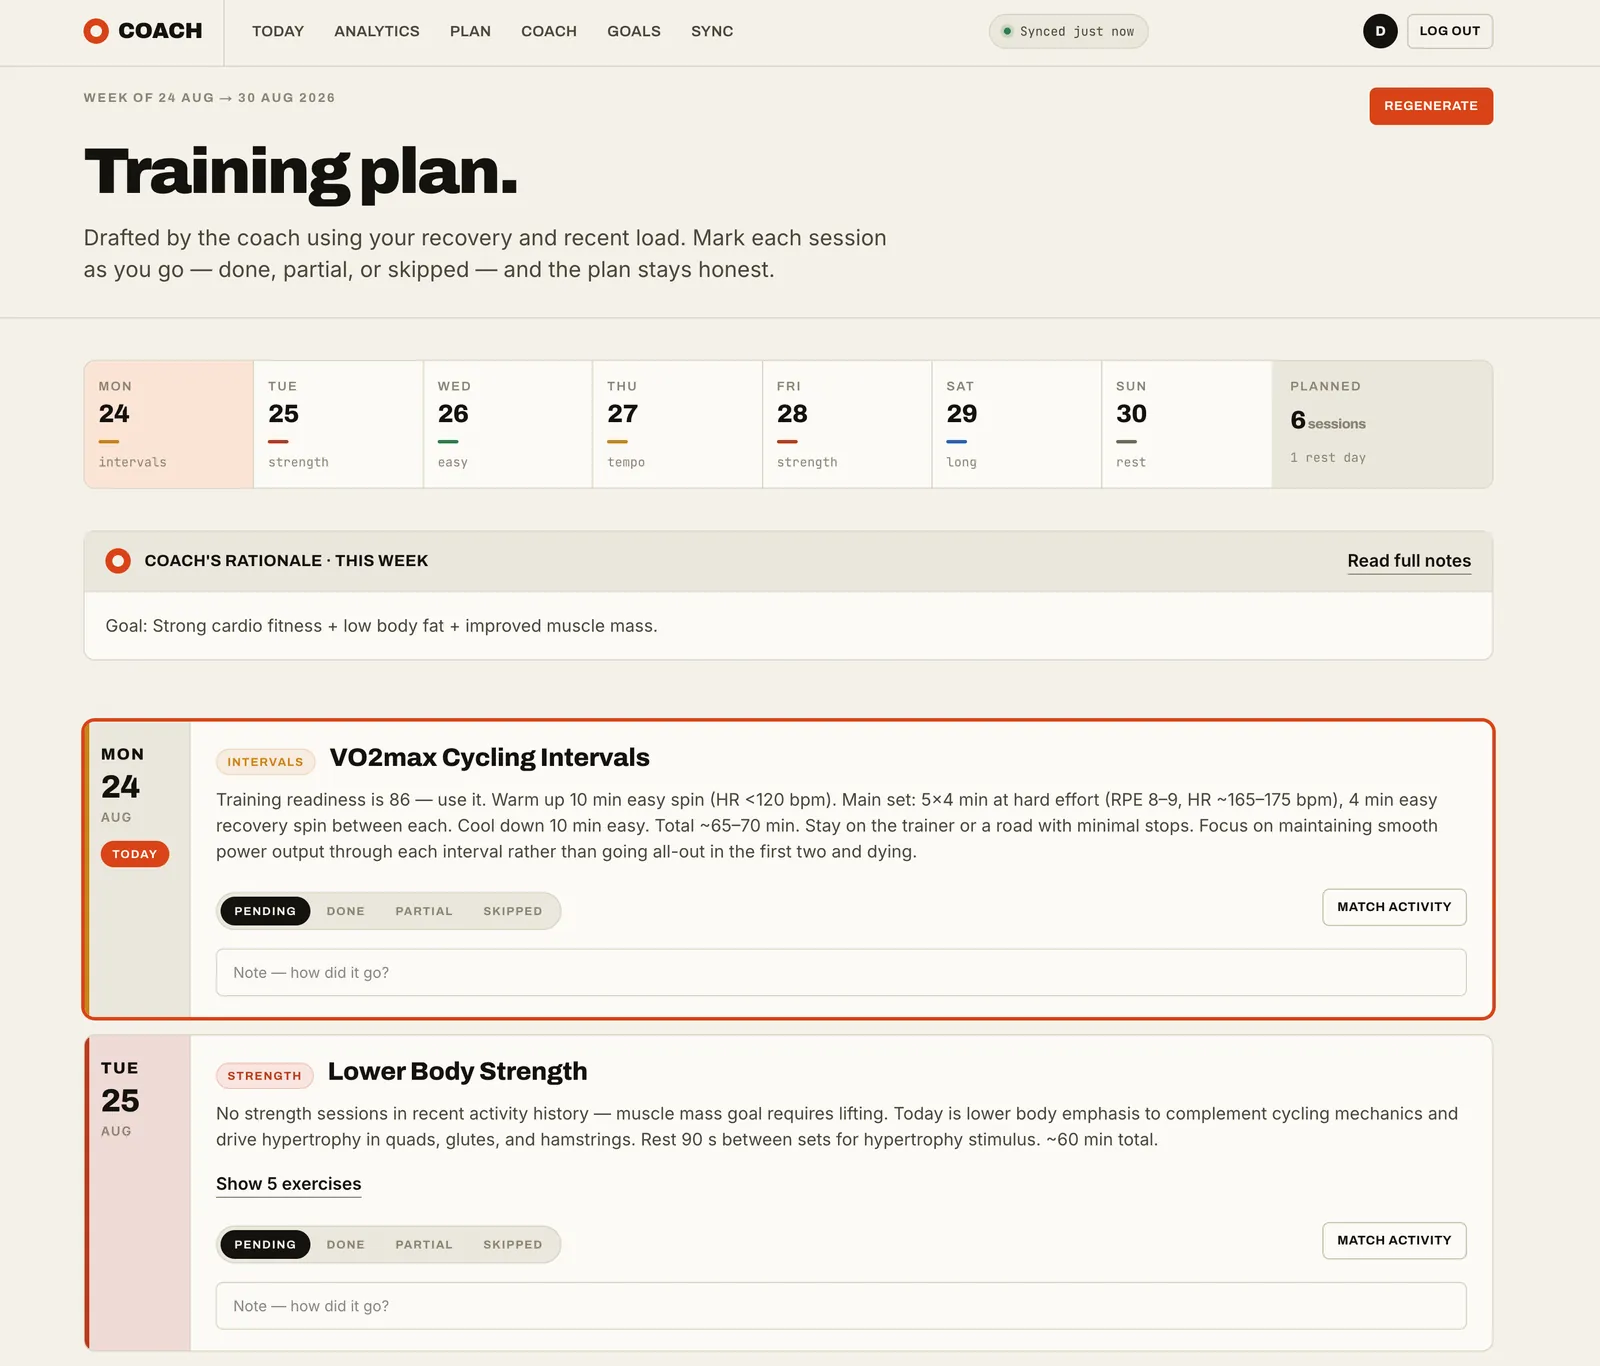
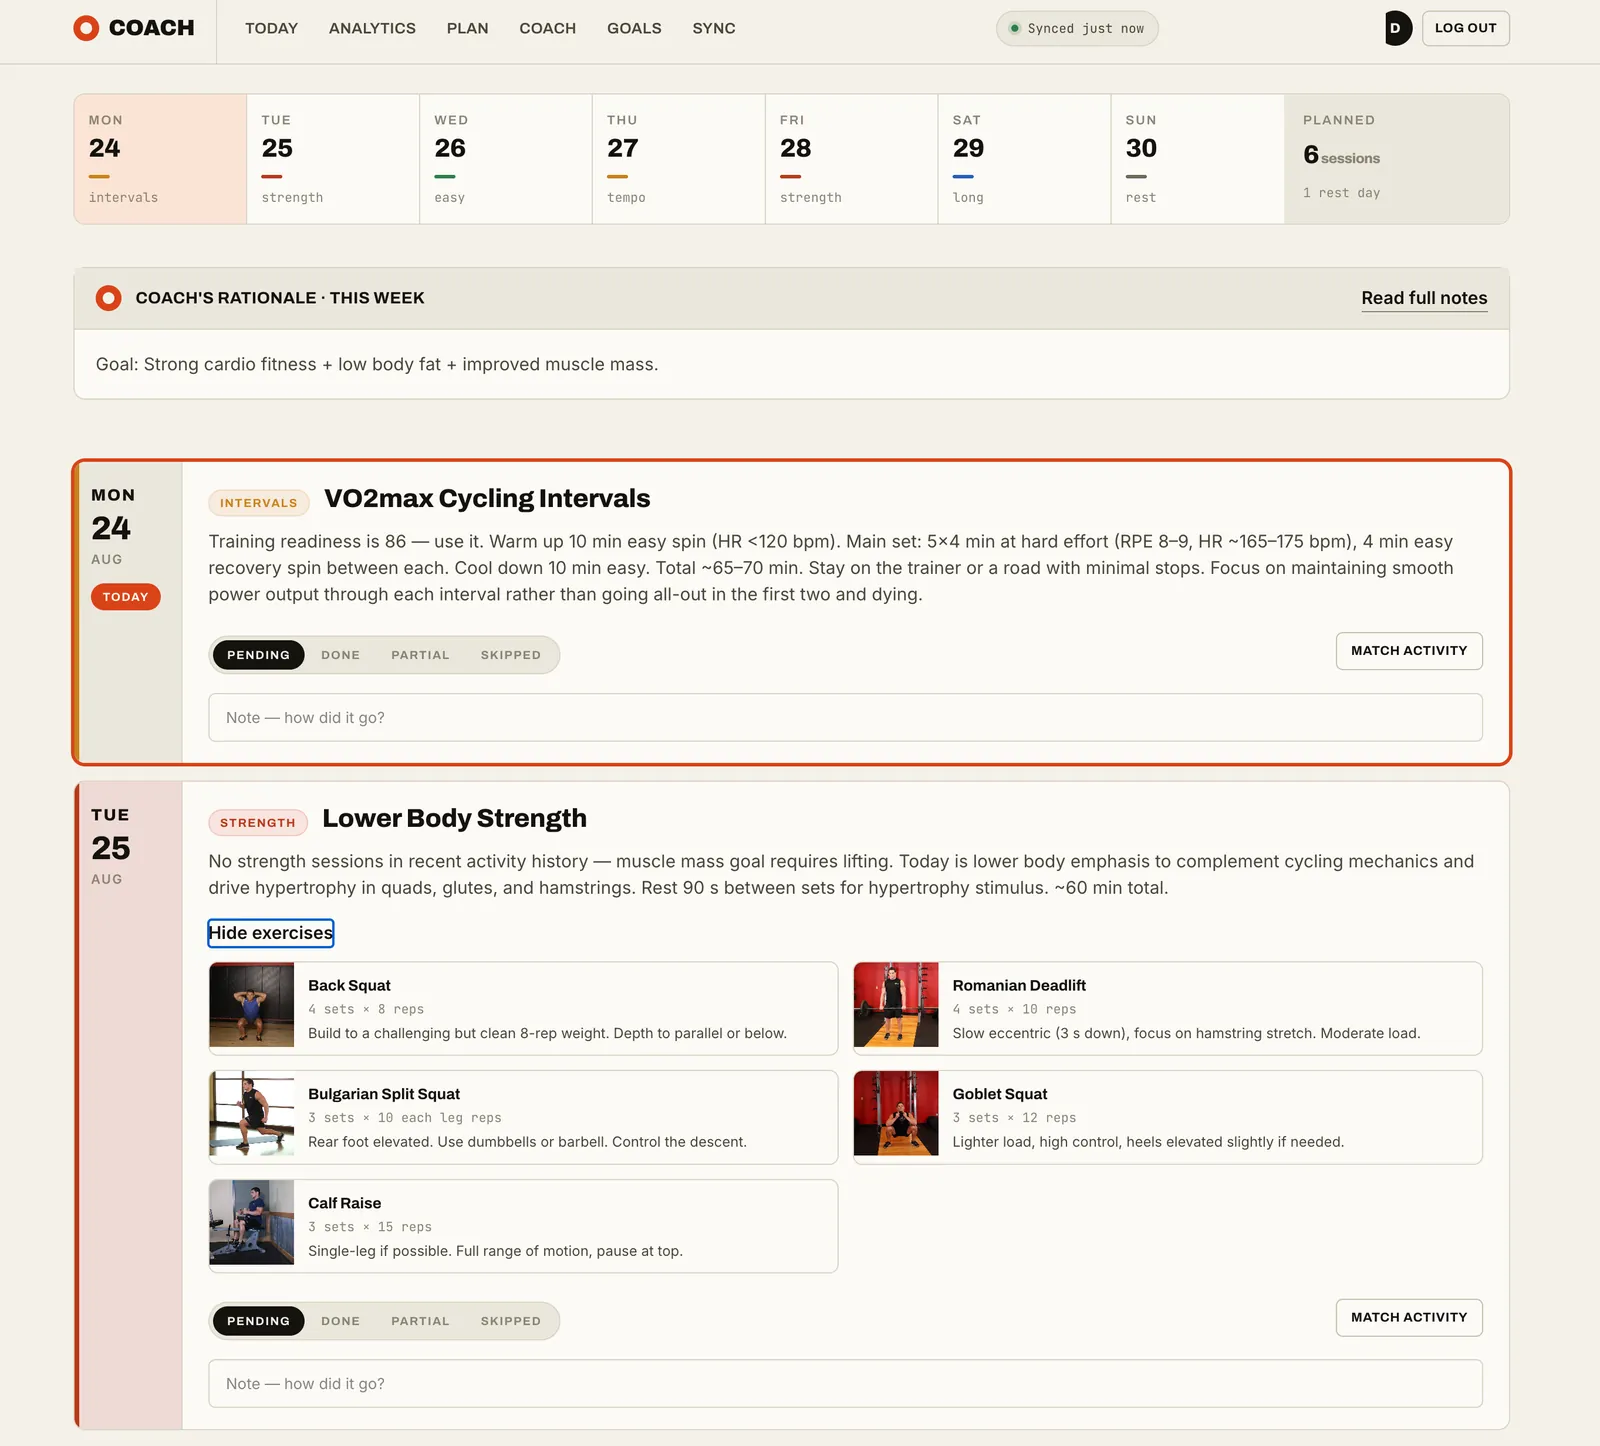
The fourth surface is the coach itself, and it is the part that changed how I use any of this. Asking "am I recovered enough for a hard session today?" gets an answer that has actually read the sleep, HRV, body battery, average stress and training readiness behind it. One morning it came back with a version of "you have done nine sessions this week, more than double your chronic norm" and told me to go light. It was right, and I would not have spotted it myself.
The analytics I did not understand
The first dashboard was pretty and shallow. To get past that, I took screenshots of what I had and asked Claude a different kind of question: all of this data comes from Garmin, so you know what is available - if you were an elite fitness trainer and biomechanist, what other analytics, correlations and dashboards would you need?
What came back was a specification: a performance management chart, a biomechanics layer, recovery analysis that goes past a seven-day rolling average, resting heart rate plotted against HRV, and more. I pasted that specification straight into Claude Code and let it build. It ran for about half an hour and burned through a five-hour usage window in one go.
Then I hit the honest part. The first output was not ready. Charts overflowed their containers, numbers were unreadable in places, legends sat on top of the values they were labelling. That cost another evening and another usage window to fix. Worth saying plainly, because "I prompted it and it worked" is rarely the whole story.
The "explain this" button
The bigger problem was that I now had beautiful charts I could not read. I do not have a sports science background - I did not know what CTL, ATL or TSB actually meant for my week.
So the second feature is a button on every chart that asks the coach to interpret what you are looking at. It takes ten or twenty seconds and returns plain prose. A real example: a TSB of +20 means you are well recovered with low fatigue, which sounds good - but combined with a CTL that has fallen from a 54 thirty-day average to 49 on a confirmed downward trend, it actually signals that training load has dropped off significantly. Which was true, and which the positive-looking number alone would have hidden.
The correlations panel is the one that earned its place. It computes three relationships - sleep against aerobic training effect, HRV against aerobic training effect, and weekly load against the following week's HRV - and, crucially, it labels each one signal, weak or noise rather than letting you read a trend into random scatter.
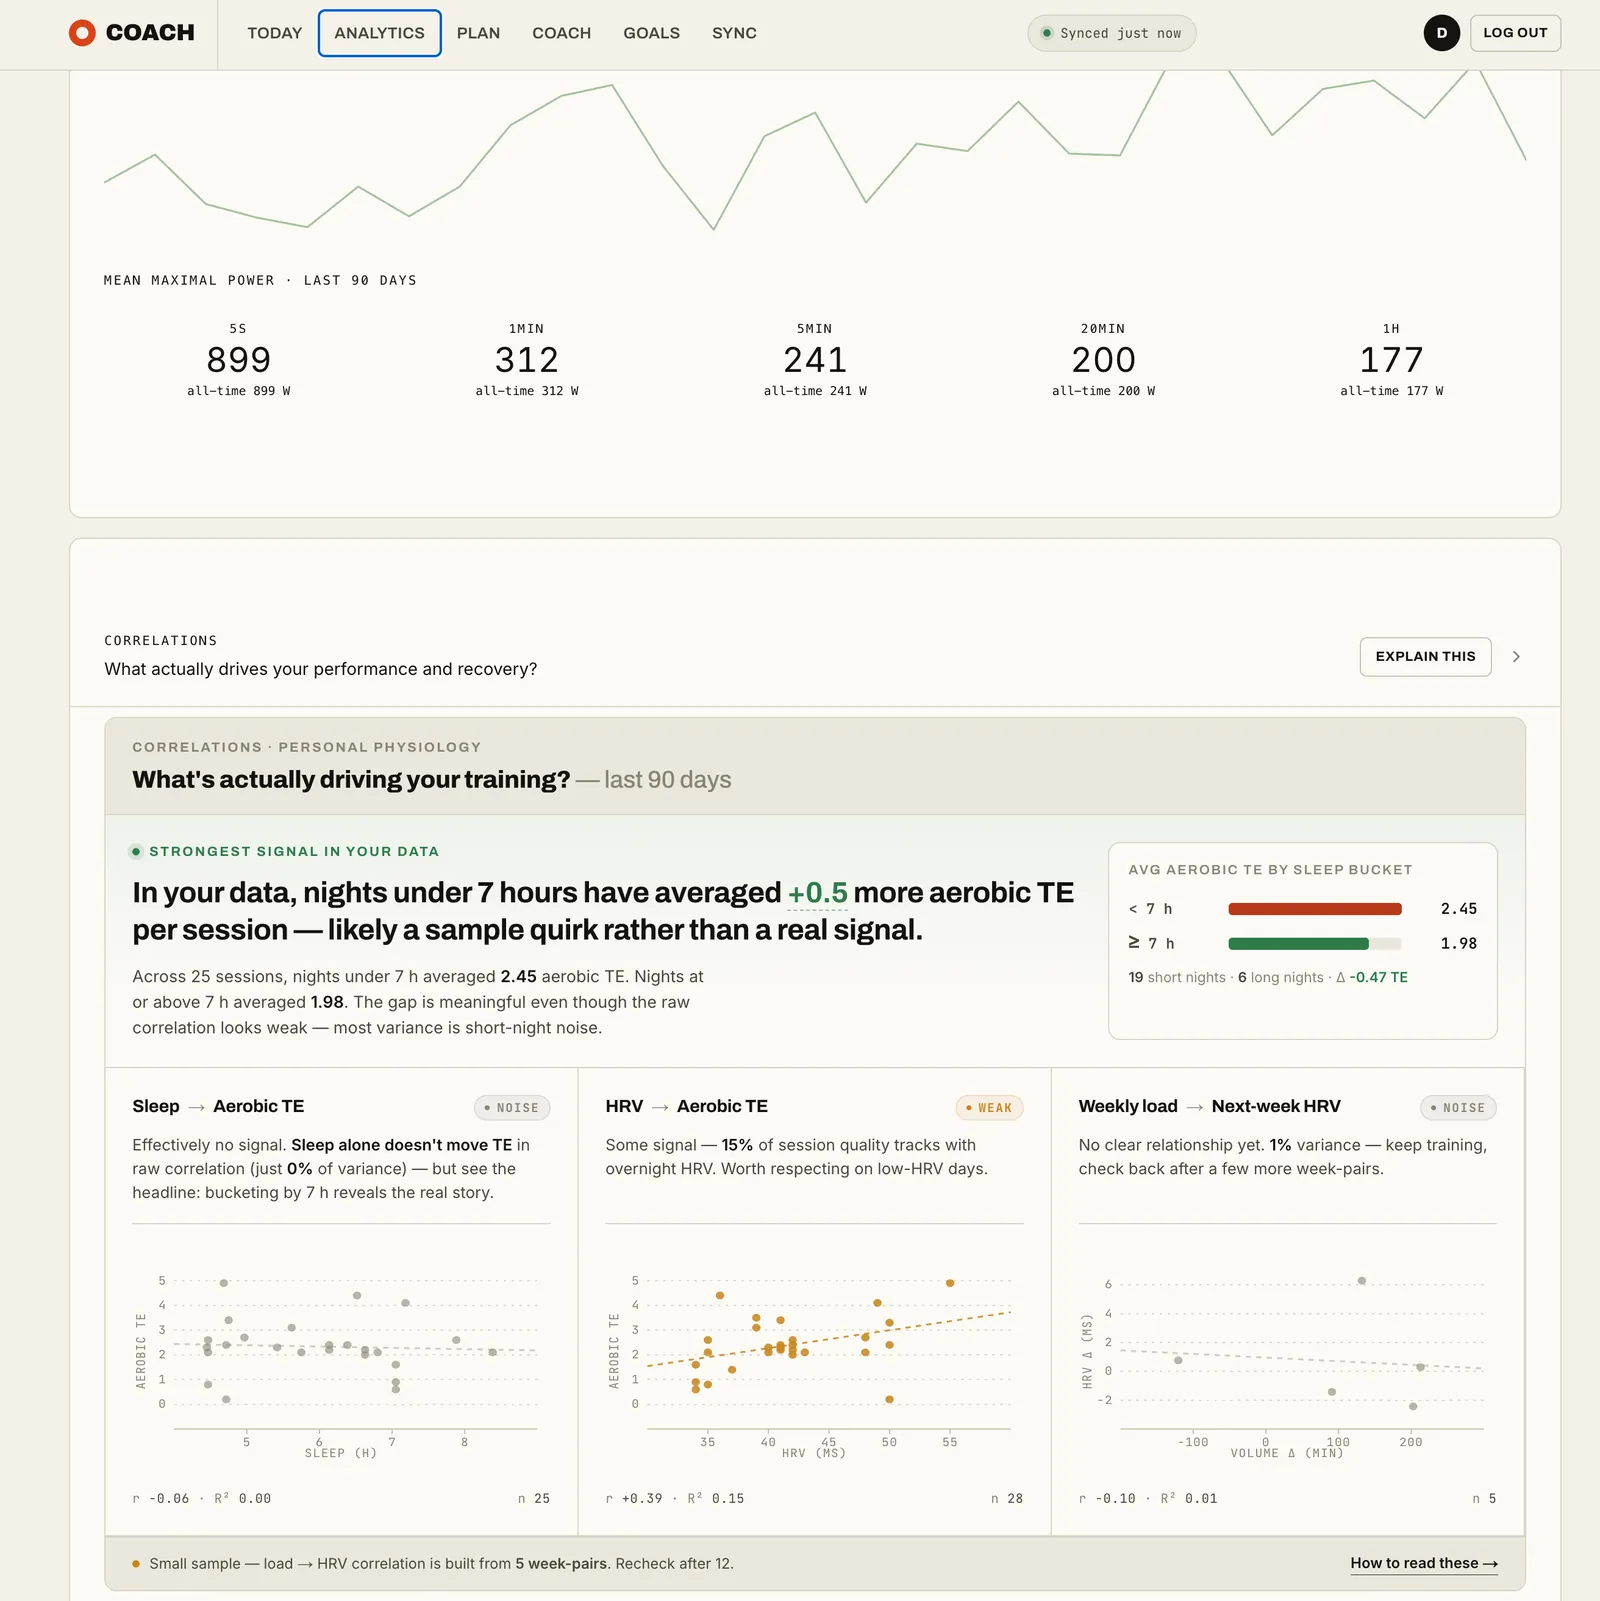
It is worth watching those labels change. With more weeks in the database, the weekly-load-to-next-week-HRV pair turned into a strong positive relationship for me: a heavy training week lifts my HRV the following week, which is the opposite of the naive expectation. My own reading is that when I am not training I carry the mental load instead, and that shows up in the numbers. Either way, it is the kind of thing you only find by putting your own data in front of something that will look for it.
How it is built
Nothing exotic. The whole thing is one Next.js application - front end and API routes in the same process - with a local SQLite file underneath.
| Layer | Choice |
|---|---|
| Runtime | Node.js 24 LTS, TypeScript 5 |
| Front end | Next.js 16 (App Router), React 19, Tailwind CSS 4 |
| Back end | Next.js API routes for sync, goals, coach and activity detail |
| Storage | Prisma 7 over SQLite - one local dev.db file |
| Garmin | garmin-connect library, plus a custom SSO and email-MFA flow |
| Coach | Claude Agent SDK, tool-calling against your own synced data |
| Scheduling | node-cron for the daily auto-sync |
The coach runs through the Claude Agent SDK against your local Claude Code session, so it bills against a subscription rather than an API key. Conversation history is stored locally and the previous turns are passed back in as context, so it remembers what you discussed yesterday.
The design was not mine either. The prototype was genuinely ugly, so I pasted screenshots into Claude Design and asked for a better proposal. What came back went in with no tuning at all - the warm palette, the widgets, the typography. For a project measured in evenings, that was a good trade.
Running it yourself
Enough people asked for this that it seemed silly not to share it. I considered hosting it as a paid service - I even added multi-account support and invite codes - but decided against it. Health data and Garmin credentials belong on your own machine, not on my server, and an unofficial integration is a poor foundation for a subscription business.
So instead of a service, you get the thing itself: the complete codebase.
Garmin AI Coach - the whole source
Not a licence, not a subscription, not a hosted account with limits. It is the entire project as a ZIP, and once you have it you can do whatever you like with it - read it, change it, rip parts out, add the features I have not got to, run it forever without paying anything again.
- No coding knowledge required. It ships with an instruction file written for an AI coding assistant. The assistant reads it and does the setup for you.
- Three steps: download it, open the folder in your AI assistant, and ask it to start the local server. That is genuinely the whole process.
- Runs entirely on your machine. Your Garmin credentials and health data stay in a local database file. Delete the folder and it is all gone.
- Yours to extend. Everything in this article is a starting point, not a ceiling.
585 KB ZIP, delivered instantly. Works with Claude Code or Codex.
What "no skills required" actually means
This is the part people do not believe until they try it. You do not read the code. You do not install dependencies by hand, configure a database, or generate secrets. The project contains a setup guide written for an AI assistant to execute, so the work is done by the assistant while you watch.
Concretely, after unzipping, you open the folder in Claude Code or Codex and say something like:
read instructions and start local serverThe assistant installs dependencies, creates the configuration file, generates the security keys, builds the local database, starts the app and tells you which address to open. It will ask permission before running commands - say yes. The first run takes a few minutes; after that, starting it again is a single command that the assistant will also happily run for you.
Then you open http://localhost:3000, sign into Garmin with the emailed
MFA code, hit Sync now to pull your last thirty days, describe what
you are training for, and start asking questions.
If something goes wrong, tell the assistant. That is the actual support model, and it works better than a troubleshooting page: paste the error text back in and ask it to fix it. It has the whole codebase in front of it.
What you need
| Requirement | Notes |
|---|---|
| A Garmin device and account | Anything that syncs to Garmin Connect. More history means better analytics. |
| Node.js | Version 20 or higher; the LTS installer from nodejs.org is fine. The assistant will tell you if it is missing. |
| An AI coding assistant | Claude Code or Codex, on Mac or Windows. Claude Code is the recommended one. |
| A Claude subscription | Pro at minimum, if you want the in-app coach to work - it runs on your local Claude session. Everything else works with either assistant. |
Honest limitations
- The Garmin integration is unofficial. It is reverse-engineered. Garmin can change an endpoint and break a metric. Individual fetches are isolated so one failure does not sink the whole sync, but the risk is real.
- The coach shares your subscription quota. On Claude Pro you are working inside five-hour usage windows. Fine for a daily check-in and a weekly plan; if you intend to chat with it constantly, a higher tier is safer.
- Auto-sync only runs while the app is running. The daily job lives inside the server process, so it needs the app to be up.
- Credentials are stored in plain text in the local database. That is an acceptable trade for a localhost-only tool on your own machine, and it is worth knowing rather than discovering.
- It is not medical advice. It is pattern-matching over your own numbers, and it is good at that. It is not a doctor.
Watch the series
Three videos, in order: the first prototype, the analytics rebuild, and the finished tour. Start with the last one if you only watch a single video - it covers what the app does today.
The two that came before it: I gave Claude my Garmin data and it noticed something I didn't covers the first build and why Garmin's data is so hard to get at, and Claude AI built Garmin data graphs that I couldn't understand is the analytics rebuild and where the "explain this" button came from.
Related
Got data trapped in a system that will not share it?
This project is a personal-scale version of something I do professionally: getting data out of a system that was not designed to give it up, then making it useful. If that is a problem you have - monitoring, integrations, or an internal tool nobody can get numbers out of - that is the kind of work I do at KorFlux.